Mortality shinyMobile app
library(shiny)
library(shinyMobile)
library(apexcharter)
library(dplyr)
w_path <- './'
deaths_y_swiss <- fst::read_fst(paste0(w_path,'deaths_1803_2020.fst'))
deaths_w_swiss <- fst::read_fst(paste0(w_path, 'deaths_weekly.fst'))
w_mortality <- fst::read_fst(paste0(w_path, 'worldmortality.fst'))
mortality <- fst::read_fst(paste0(w_path,'mortality.fst'))
ui <- f7Page(title = "Mortality over past years",options = list(theme="auto"),
f7Tabs(animated = TRUE,
f7Tab(tabName = "Swiss weekly", icon = f7Icon("chart_bar_circle"), active = TRUE,
f7Shadow(intensity = 10,hover = TRUE,
f7Card(title = "Deaths per week in Switzerland separated in 2 age groups",
f7Link(label = "Data source", href = "https://www.bfs.admin.ch/bfs/en/home/statistics/health/state-health/mortality-causes-death.assetdetail.12607336.html"),
apexchartOutput("weekplot"),
f7Link(label = "Source code of this app", href = "https://blog.analysed.ch/books/analysedch-apps/page/mortality-shinymobile-app"))
)
),
f7Tab(tabName = "Swiss annual", icon = f7Icon("chart_bar_circle_fill"), active = FALSE,
f7Shadow(intensity = 10, hover = TRUE,
f7Card(title = "Deaths since 1803 separated by sex",
f7Link(label = "Data source", href = "https://www.bfs.admin.ch/bfs/en/home/statistics/catalogues-databases/data.assetdetail.17664404.html"),
apexchartOutput("yearplot"),
f7Select(inputId = "swiss_y",label = "Demographic feature:",
choices = c('Under 20 years', '20-39 years','40-64 years','65-79 years', '80 years or more','Age unknown','Swiss','Foreigner', 'Nationality unknown', 'Single','Married','Widowed', 'Divorced','Unmarried','In a registered partnership', 'Partnership dissolved', 'Marital status unknown','Deaths - total'), selected = '20-39 years')
)
)
),
f7Tab(tabName = "H. mortality data", icon = f7Icon("chart_bar_alt_fill"), active = FALSE,
f7Shadow(intensity = 10,hover = TRUE,
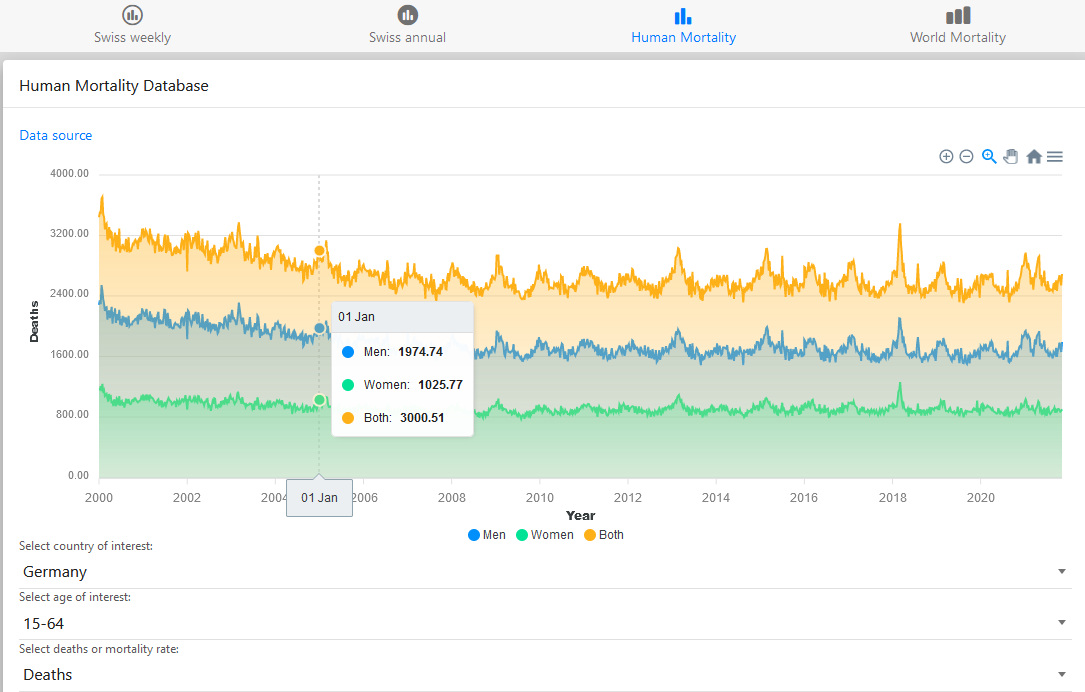
f7Card(title = "Human Mortality Database",
f7Link(label = "Data source", href = "https://www.mortality.org/"),
apexchartOutput("worldplot"),
f7Select(inputId = "world_country", label = "Select country of interest:",
choices = c("Australia", "Austria", "Belgium", "Bulgaria", "Canada", "Chile", "Croatia", "Czech Republic", "Denmark", "England and Wales", "Estonia", "Finland", "France", "Germany", "Greece", "Hungary", "Iceland", "Israel", "Italy", "Latvia", "Lithuania", "Luxembourg", "Netherlands", "New Zealand", "Northern Ireland", "Norway", "Poland", "Portugal", "Russia", "S. Korea", "Scotland", "Slovakia", "Slovenia", "Spain", "Sweden", "Switzerland", "Taiwan", "USA"), selected = "Germany"),
f7Select(inputId = "world_age", label = "Select age of interest:",
choices = c('0-14', '15-64', '65-74', '75-84', '85+', 'Total'), selected = '15-64'),
f7Select(inputId = "world_rate", label = "Select deaths or mortality rate:",
choices = c('Deaths', 'Rate'), selected = 'Deaths')
)
)
),
f7Tab(tabName = "W. mortality data", icon = f7Icon("chart_bar_fill"), active = FALSE,
f7Shadow(intensity = 10, hover = TRUE,
f7Card(title = "World Mortality Dataset",
f7Link(label = "Data source", href = "https://github.com/akarlinsky/world_mortality"),
apexchartOutput("world_mortality"),
f7Select(inputId = "country_n",label = "Select country:",
choices = c("Albania", "Andorra", "Antigua and Barbuda", "Argentina", "Armenia", "Aruba","Australia", "Austria", "Azerbaijan", "Belarus", "Belgium", "Belize", "Bermuda","Bolivia", "Bosnia", "Brazil", "Bulgaria", "Canada","Chile","Colombia","Costa Rica","Croatia", "Cuba", "Cyprus", "Czechia", "Denmark", "Dominican Republic", "Ecuador","Egypt", "El Salvador", "Estonia","Faroe Islands","Finland","France","French Guiana","French Polynesia","Georgia","Germany","Gibraltar","Greece","Greenland","Guadeloupe","Guatemala","Hong Kong","Hungary","Iceland","Iran","Ireland","Israel","Italy","Jamaica","Japan","Kazakhstan","Kosovo","Kuwait","Kyrgyzstan","Latvia","Lebanon","Liechtenstein","Lithuania","Luxembourg","Macao","Malaysia","Malta","Martinique","Mauritius","Mayotte","Mexico","Moldova","Monaco","Mongolia","Montenegro","Netherlands","New Caledonia","New Zealand","Nicaragua","North Macedonia","Norway","Oman","Panama","Paraguay","Peru","Philippines","Poland","Portugal","Puerto Rico","Qatar","Réunion","Romania","Russia","San Marino","Serbia","Seychelles","Singapore","Slovakia","Slovenia","South Africa","South Korea","Spain","Sweden","Switzerland","Taiwan","Tajikistan","Thailand","Transnistria","Tunisia","Ukraine","United Kingdom","United States","Uruguay","Uzbekistan"), selected = 'Switzerland')
)
)
)
)
)
server = function(input, output, session) {
output$weekplot <- renderApexchart({apex(data = deaths_w_swiss,
type = "area", mapping = aes(x = Year, y = Deaths, fill = Age)) %>%
ax_yaxis(title = list(text = "Deaths")) %>%
ax_xaxis(title = list(text = "Year"))})
output$yearplot <- renderApexchart({apex(data = deaths_y_swiss %>% filter(demo_var == input$swiss_y),
type = "area", mapping = aes(x = year, y = deaths, fill = sex)) %>%
ax_yaxis(title = list(text = "Deaths")) %>%
ax_xaxis(title = list(text = "Year"))})
output$worldplot <- renderApexchart({
apex(data = mortality %>% filter(CountryCode == input$world_country, Age== input$world_age, Rate==input$world_rate),
type = "area", mapping = aes(x = Year, y = Deaths, fill = Sex)) %>%
ax_yaxis(title = list(text = "Deaths")) %>%
ax_xaxis(title = list(text = "Year"))})
output$world_mortality <- renderApexchart({apex(data = w_mortality %>% filter(country_name == input$country_n),
type = "area", mapping = aes(x = date, y = deaths)) %>%
ax_yaxis(title = list(text = "Deaths")) %>%
ax_xaxis(title = list(text = "Year"))})
}
shinyApp(ui, server)

No Comments